REW Shows You The Problem. AudioBro Explains What To Do About It.

You've Measured Your Room. Now What?
Every year, thousands of audio enthusiasts buy a measurement microphone, download Room EQ Wizard (REW), and run their first room measurement.
The process usually starts with excitement.
For the first time, you're seeing what your room is actually doing.
Not what you think it's doing.
Not what a reviewer says it should be doing.
Not what your ears are trying to interpret.
Actual evidence.
Then something unexpected happens.
Instead of clarity, many people become more confused than they were before.
A graph appears on the screen.
There are peaks.
There are dips.
There are strange shapes.
The bass looks terrible.
Maybe the treble looks uneven.
Someone on a forum tells you it's a room mode.
Another person says it's SBIR.
A third person says you need acoustic treatment.
Someone else says you need a second subwoofer.
Before long, you've got ten different opinions, twenty browser tabs open, and no real confidence about what to do next.
This is where many audio journeys stall.
Not because REW failed.
Not because measurements don't work.
But because measurement and interpretation are two completely different skills.
Measuring a room is relatively easy.
Understanding what the measurements mean is much harder.
That's the gap this article is designed to help close.
What Is REW?
REW, short for Room EQ Wizard, is one of the most widely used acoustic measurement tools in the world.
It is used by:
- Audiophiles
- Home theater enthusiasts
- Acoustic consultants
- Loudspeaker designers
- Installers
- Recording engineers
- Manufacturers
What makes REW remarkable is that it provides professional-grade measurement capabilities at no cost.
Using a calibrated measurement microphone such as the miniDSP UMIK-1, REW can capture detailed information about how your room and audio system behave.
Rather than relying on subjective impressions alone, REW allows you to see what is happening acoustically.
This is important because rooms often behave very differently from what listeners expect.
A system that sounds bass-heavy may actually have a large bass peak caused by the room.
A system that sounds thin may be suffering from cancellations rather than a lack of speaker capability.
A system that seems harsh may be dealing with reflections rather than a problem with the speakers themselves.
Without measurement, these issues are often misdiagnosed.
With measurement, they become visible.
Why REW Became The Industry Standard
The reason REW became so popular is simple.
It answers questions that are otherwise difficult or impossible to answer.
For example:
- Why does bass sound strong in one seat and weak in another?
- Why does dialogue sound unclear?
- Why do expensive speakers sound disappointing in some rooms?
- Why does one subwoofer location sound dramatically different from another?
- Why does the system sound different after moving furniture?
REW provides objective evidence.
It removes much of the guesswork.
Instead of relying entirely on opinion, assumptions, or marketing claims, users can evaluate what is actually happening inside their room.
This is one of the reasons experienced enthusiasts often say:
Measure first. Buy later.
Many upgrade decisions become obvious once measurements are available.
In some cases, a speaker upgrade is the right move.
In many cases, however, the measurements reveal that placement, acoustics, room geometry, or bass integration are the real issues.
This is where significant savings can occur.
Because solving the correct problem is almost always cheaper than repeatedly upgrading equipment in search of a solution.
What Can REW Actually Measure?
One of the biggest misconceptions about REW is that it only produces frequency response graphs.
In reality, REW is an extremely powerful measurement platform capable of analysing multiple aspects of room and system performance.
Each measurement type tells a different part of the story.
Understanding those measurement types is the first step toward understanding what your room is trying to tell you.
Frequency Response
Frequency response is the graph most people encounter first.
It shows how loud different frequencies are at the listening position.
This measurement often reveals:
- Bass peaks
- Bass nulls
- Tonal imbalances
- Placement issues
- Room interactions
It is usually the starting point for diagnosis.
However, frequency response alone does not tell the whole story.
Two systems can have similar frequency response measurements and sound dramatically different.
This is where additional measurements become important.
Waterfall Graphs
Waterfall graphs add a time component to the analysis.
Instead of showing only level, they show how sound energy decays over time.
This helps identify:
- Ringing bass
- Long decay times
- Resonant frequencies
- Energy build-up
A room may have reasonably smooth frequency response while still suffering from excessive bass decay.
The result can sound muddy, slow, or bloated despite looking acceptable on a simple response graph.
RT60 Measurements
RT60 measures how long sound takes to decay within a room.
In simple terms, it helps describe how live or dead a room is.
Rooms with excessive reverberation often suffer from:
- Reduced clarity
- Poor speech intelligibility
- Smearing of detail
- Listener fatigue
Rooms with extremely low reverberation can feel unnatural and lifeless.
The goal is balance.
Impulse Response
Impulse response measurements help reveal timing behaviour within a room.
They provide insight into:
- Reflections
- Arrival times
- System timing
- Acoustic interactions
Many advanced analyses ultimately begin with impulse response data.
Phase Response
Phase response becomes especially important when integrating subwoofers and speakers.
Timing differences can cause:
- Bass cancellations
- Weak crossover regions
- Reduced impact
- Inconsistent response
This is one of the areas where measurements frequently uncover problems that are almost impossible to identify reliably by ear alone.
Distortion Measurements
REW can also measure distortion.
While room problems are often the primary concern, distortion measurements can help identify limitations within loudspeakers, subwoofers, or playback systems.
In some cases, apparent room issues may actually be hardware limitations.
Measurement helps separate one from the other.
Why Most People Get Stuck After Their First Measurement
This is where things become interesting.
Most people assume the difficult part is collecting the data.
In reality, collecting the data is usually the easy part.
The difficult part is deciding:
What matters?
Imagine a graph showing:
- A 12dB peak at 40Hz
- A 10dB dip at 70Hz
- Uneven response above 200Hz
- Some decay issues below 80Hz
What should be fixed first?
Most beginners don't know.
Many enthusiasts don't know either.
The natural tendency is to try to fix everything.
This often leads to:
- Excessive EQ
- Constant tweaking
- Upgrade chasing
- Analysis paralysis
The result is frustration.
Because not all problems are equally important.
Some issues have enormous audible impact.
Others are barely noticeable during real listening.
One of the most valuable skills in room optimisation is learning how to separate major issues from minor ones.
That is where interpretation becomes more valuable than measurement itself.
Understanding Frequency Response Graphs
If you're new to REW, the frequency response graph is usually the first thing you'll see.
It's also the graph most people misunderstand.
At its simplest, a frequency response graph shows how loudly your system reproduces different frequencies at the measurement position.
The horizontal axis represents frequency.
The vertical axis represents level.
A perfectly flat line might seem like the ideal outcome.
In reality, things are more complicated.
Every room influences the sound you hear.
Walls, floors, ceilings, furniture, speaker placement, listening position, and room dimensions all interact with the direct sound from your speakers.
The graph is not simply showing your speakers.
It's showing your speakers and your room working together.
This distinction is critical.
Many enthusiasts spend thousands of dollars changing speakers when the measurements are actually revealing room problems.
What Peaks Usually Mean
Large peaks are often caused by room interactions.
Common causes include:
- Room modes
- Boundary reinforcement
- Subwoofer placement
- Seating position
A significant peak often sounds:
- Boomy
- Thick
- Over-emphasised
- Slow
These frequencies draw attention to themselves.
They can dominate the listening experience.
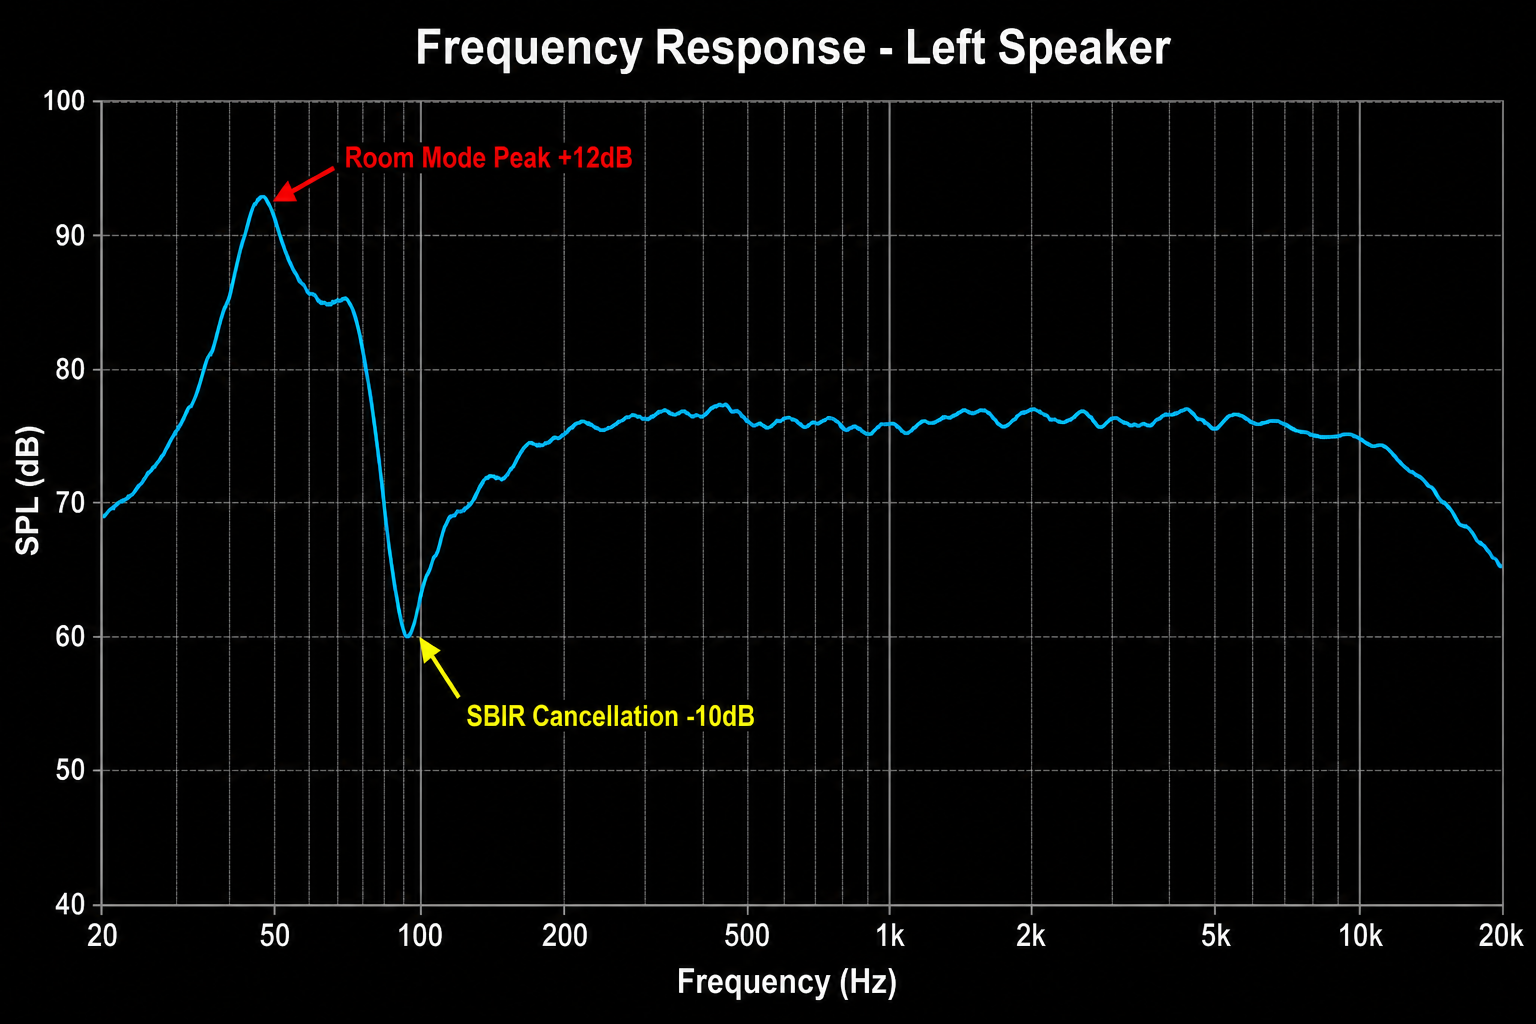 A typical room frequency response in REW showing a 12dB peak at 45Hz caused by a room mode and a 10dB dip at 75Hz caused by SBIR. These are the problems AudioBro helps you identify and prioritise.
What Dips Usually Mean
Dips are often more difficult to solve.
Common causes include:
- Room modes
- SBIR
- Phase cancellation
- Poor integration between speakers and subwoofers
One of the biggest mistakes beginners make is trying to equalise every dip.
This rarely ends well.
If a cancellation is caused by geometry, adding more EQ often adds more amplifier power without solving the underlying acoustic problem.
The room continues cancelling the energy.
Not Every Imperfection Matters
This is one of the most important lessons in room optimisation.
Not every visible issue is audible.
Not every audible issue is visible.
Some enthusiasts become obsessed with achieving a perfectly smooth graph.
The result is often endless tweaking.
A better goal is understanding which problems are having the greatest audible impact.
The best systems are not necessarily the ones with the prettiest graphs.
They're the systems where the major problems have been addressed intelligently.
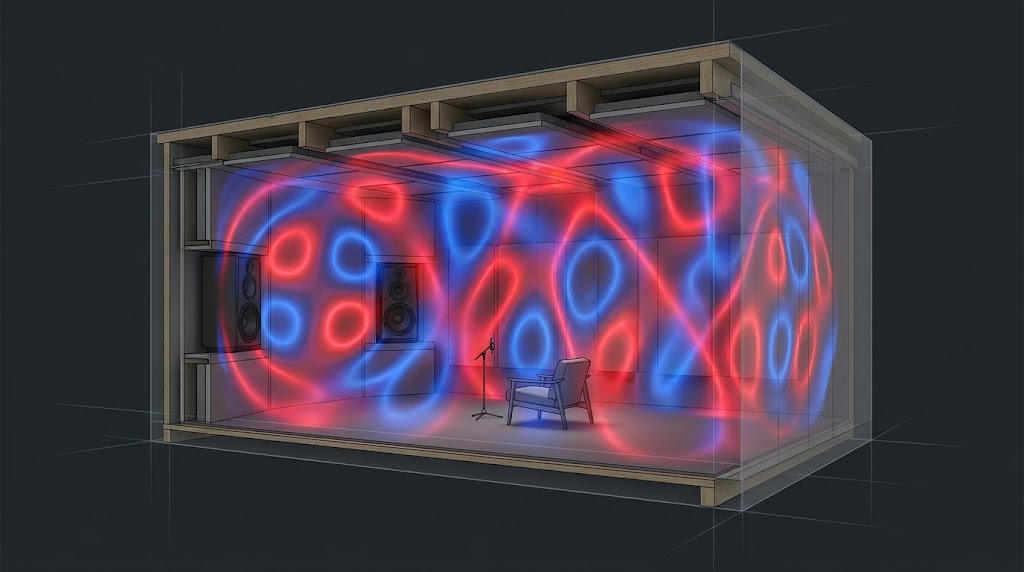
Understanding Room Modes
Room modes are one of the most common causes of bass problems in domestic listening rooms.
They're also one of the most misunderstood.
Every room has resonant frequencies determined by its dimensions.
When sound energy matches these resonances, certain frequencies become exaggerated or cancelled.
This creates uneven bass performance.
Symptoms Of Room Modes
Many common complaints are actually symptoms of room modes.
For example:
- Bass sounds great in one seat but terrible in another
- Certain bass notes are much louder than others
- Some frequencies seem to disappear completely
- Bass sounds bloated and uncontrolled
These issues can occur even with extremely expensive equipment.
The room does not care how much your speakers cost.
Physics still applies.
Types Of Room Modes
There are three primary categories.
Axial Modes
The strongest and most significant.
These occur between opposing surfaces.
Examples:
- Front wall to rear wall
- Side wall to side wall
- Floor to ceiling
Tangential Modes
These involve four room boundaries.
They are generally less severe than axial modes but still contribute to room behaviour.
Oblique Modes
These involve six room boundaries simultaneously.
They are typically the least significant but remain part of the overall acoustic picture.
Why Gear Rarely Solves Room Modes
One of the biggest misconceptions in audio is that room mode problems can be solved with better equipment.
A room mode is fundamentally a room problem.
Changing amplifiers does not remove it.
Changing DACs does not remove it.
Changing cables certainly does not remove it.
Possible solutions often include:
- Moving speakers
- Moving subwoofers
- Moving seating
- Using multiple subwoofers
- Applying acoustic treatment
- Strategic equalisation
Notice how most of those solutions involve the room rather than the electronics.
That's why room optimisation frequently delivers greater improvements than equipment upgrades.
Understanding SBIR
SBIR stands for Speaker Boundary Interference Response.
It's one of the least understood acoustic problems despite being incredibly common.
In simple terms, SBIR occurs when sound from the speaker combines with reflections from nearby boundaries.
These reflections arrive slightly later than the direct sound.
When they combine, cancellations occur.
The result can be dramatic dips in frequency response.
Common Sources Of SBIR
The most common boundaries are:
- Front walls
- Side walls
- Floors
- Ceilings
The distance between the speaker and the boundary largely determines where the cancellation occurs.
This is why moving a speaker by even a relatively small amount can produce surprisingly large changes in measured response.
Symptoms Of SBIR
SBIR often presents as:
- Bass dips
- Reduced impact
- Weakness in specific frequency ranges
- Poor imaging
- Lack of clarity
The frustrating part is that many users assume their speakers are underperforming.
In reality, the room is partially cancelling their output.
Why EQ Often Fails
This is where many enthusiasts lose months of time.
They see a dip.
They boost the dip.
The dip remains.
The reason is simple.
The room is cancelling the sound.
Adding more energy does not necessarily remove the cancellation.
This is why placement often produces bigger improvements than equalisation.
You cannot always EQ your way out of a geometry problem.
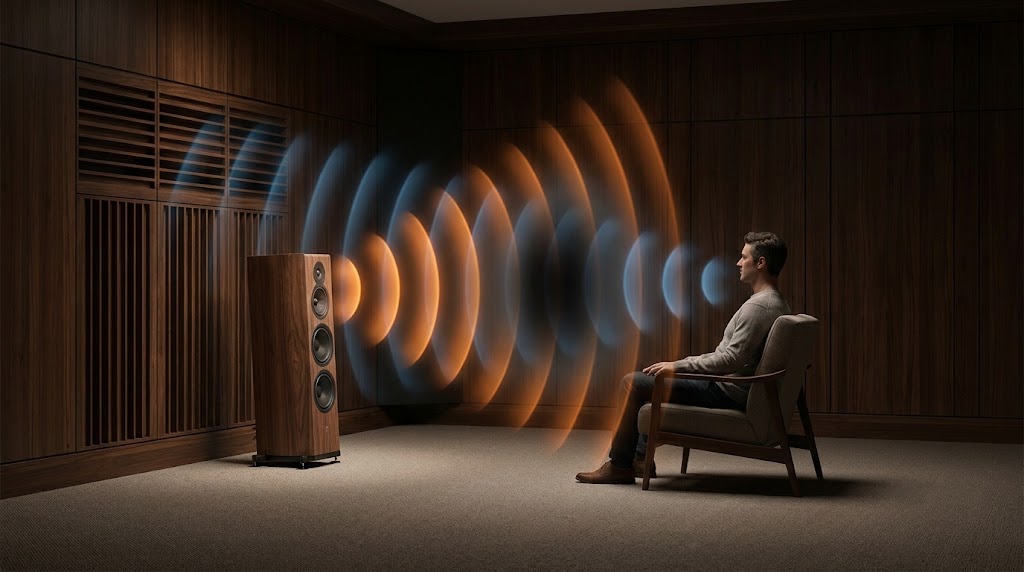 SBIR in action: direct sound from the speaker combines with the reflected wave from the front wall. Where they meet out of phase, frequencies cancel — creating the dips that EQ cannot fix.
How Distance Determines The SBIR Null
The frequency of the SBIR cancellation is directly related to the distance between the speaker and the nearest boundary. Here are some common examples:
- Speaker 60cm (2 feet) from the front wall → cancellation dip around 140Hz
- Speaker 90cm (3 feet) from the front wall → cancellation dip around 95Hz
- Speaker 120cm (4 feet) from the front wall → cancellation dip around 70Hz
This is why small speaker movements can produce surprisingly large changes in measured response. Moving a speaker just 15-20cm can shift a problematic SBIR dip away from a critical frequency range — often the difference between thin, hollow-sounding vocals and natural, full midrange.
Many enthusiasts spend months trying to equalise these dips. They see the null on the graph. They apply a boost. The null remains. The reason is straightforward: the room is actively cancelling the energy at that frequency. The reflected wave from the wall arrives at the listening position out of phase with the direct sound, and the two waves destructively interfere. Boosting with EQ simply sends more energy into the same cancellation. The amplifier works harder. The null stays. Only changing the geometry — moving the speaker relative to the boundary — changes the interference pattern.
Understanding Waterfall Graphs
Frequency response tells you how loud a frequency is.
Waterfall graphs tell you how long it stays around.
This distinction is incredibly important.
Imagine striking a piano note.
The note should decay naturally.
Now imagine that note continuing far longer than intended.
The result becomes blurred.
Bass behaves the same way.
What Waterfall Graphs Reveal
Waterfall graphs help identify:
- Ringing
- Resonances
- Energy storage
- Excessive decay
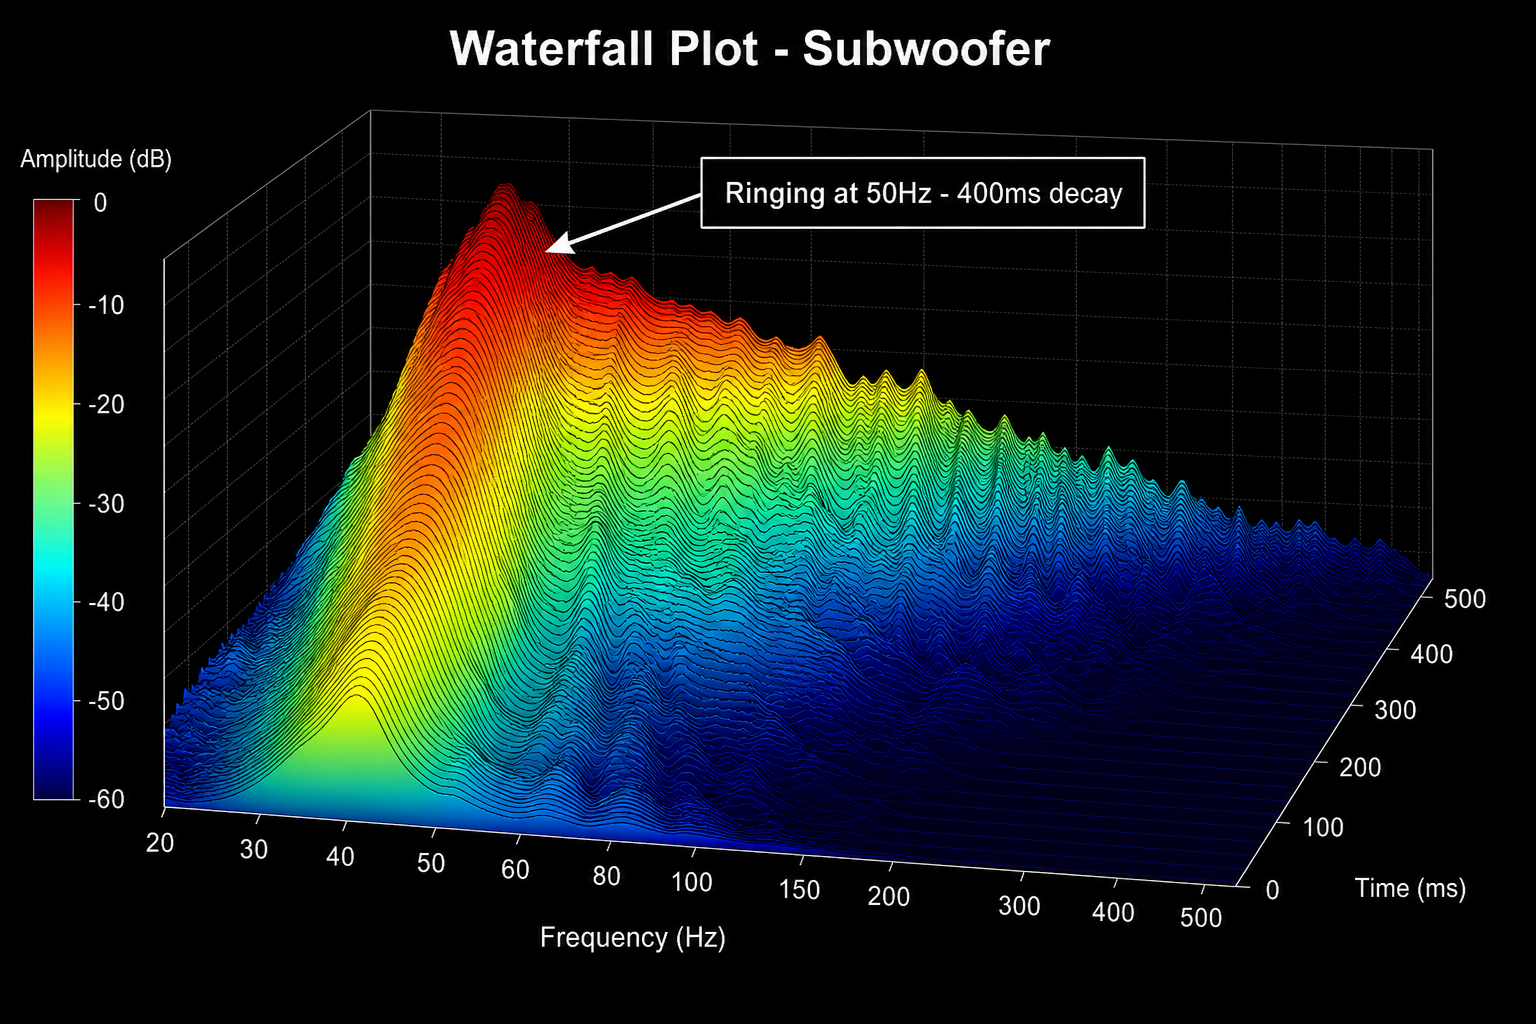 A waterfall plot showing excessive bass decay at 50Hz. The ridge persists for over 400ms — this is what muddy, slow bass looks like in measurement data.
What Good vs Bad Decay Looks Like
A well-controlled room typically shows bass decay times of 200-300ms. A problematic room often shows 500-700ms or more at resonant frequencies.
The difference is immediately audible. At 300ms, bass sounds tight, controlled, and articulate. Individual bass notes are distinct. At 700ms, bass becomes muddy and bloated. Each new bass note arrives before the previous one has finished decaying, creating a wall of indistinct low-frequency energy. This is what listeners describe as 'one-note bass' — every bass note sounds the same because the room's resonance dominates the speaker's output.
A common example: a room mode at 50Hz might show energy persisting for 400ms or more on the waterfall, while frequencies above 200Hz decay cleanly within 100-150ms. That single 50Hz ridge on the waterfall is often responsible for the majority of perceived bass problems in a room.
These issues may not always appear obvious on a frequency response graph.
Yet they can have a significant impact on perceived sound quality.
Why Long Decay Sounds Bad
Excessive decay often creates:
- Muddy bass
- Reduced punch
- Poor definition
- Lower perceived clarity
Many listeners describe this as slow bass.
The problem is not that the bass itself is slow.
The room is storing energy and releasing it over time.
Common Causes
Excessive decay is often linked to:
- Room modes
- Poor subwoofer placement
- Insufficient bass trapping
- Small room resonances
The measurement helps reveal where those issues exist.
The next challenge is determining which solution provides the greatest improvement.
Understanding Phase Alignment
Phase is one of the most intimidating subjects in audio.
Fortunately, the basic concept is straightforward.
Sound waves arrive at different times.
When they arrive together, they reinforce each other.
When they arrive out of sync, they can partially cancel each other.
Why Phase Matters
Phase becomes especially important when:
- Integrating subwoofers
- Using multiple subwoofers
- Crossing speakers to subs
- Managing delays
Poor phase alignment can create:
- Weak bass
- Uneven response
- Reduced impact
- Crossover problems
A Common Example
Imagine your subwoofer and speakers are both reproducing frequencies around the crossover point.
If they arrive at the listening position out of sync, they may partially cancel each other.
The measurement might show a large dip.
Many users assume:
"My subwoofer isn't powerful enough."
In reality, the issue may simply be timing.
A delay adjustment or placement change can sometimes produce dramatic improvements.
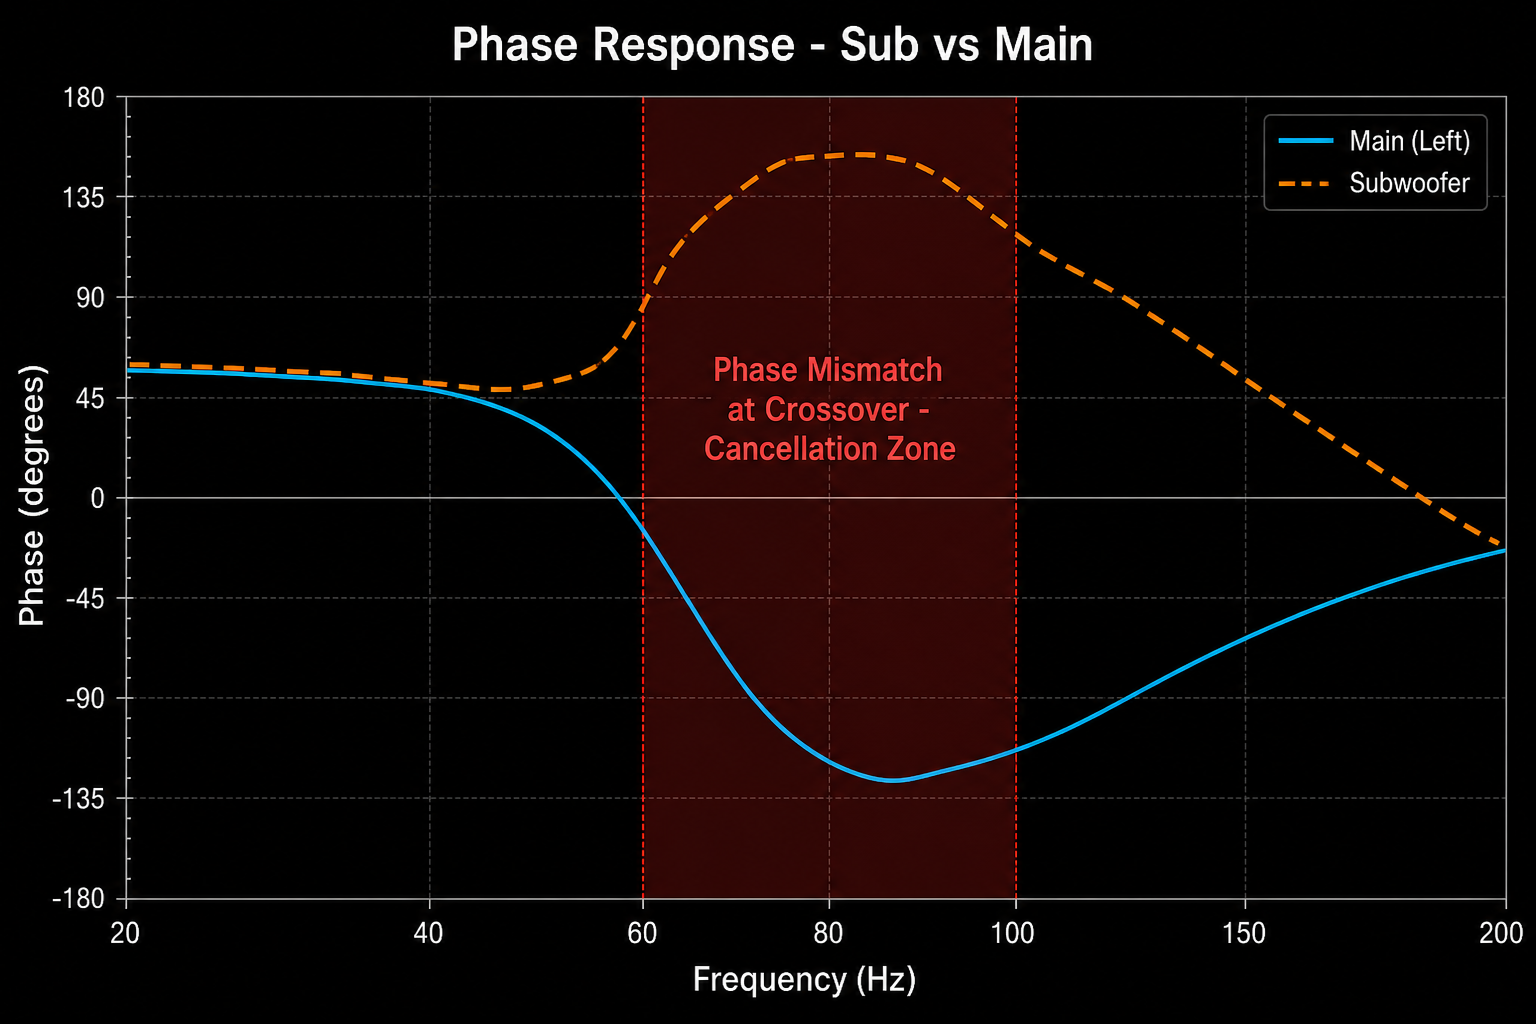 Phase response showing a timing mismatch between subwoofer and main speakers around the crossover region. This mismatch causes cancellation that many users mistake for insufficient subwoofer power.
Why Measurements Matter
Phase problems are notoriously difficult to diagnose by ear.
Measurements make them visible.
This allows users to identify timing issues that would otherwise remain hidden.
As systems become more complex, measurement becomes increasingly valuable because it helps separate acoustic reality from assumption.
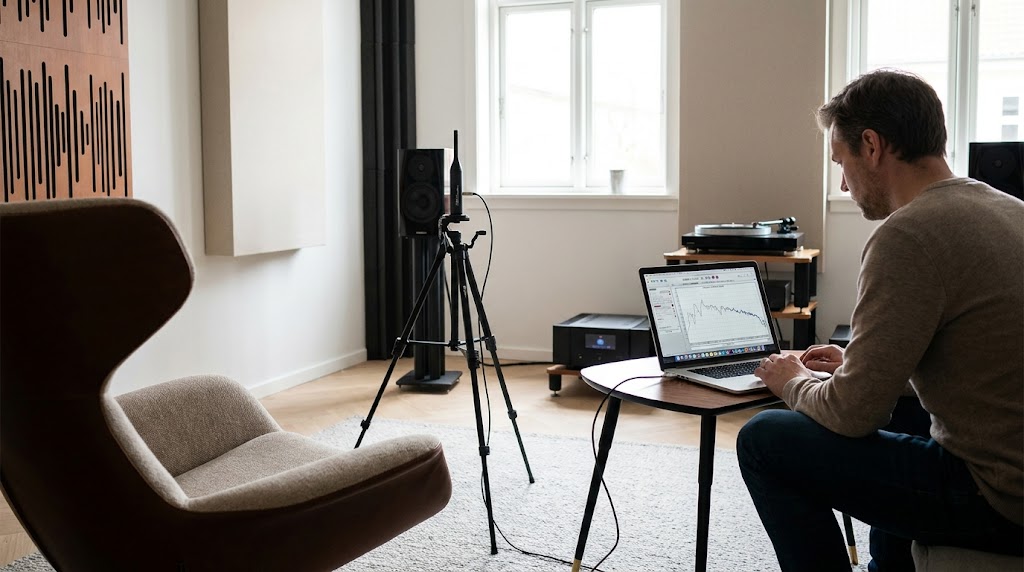
The UMIK-1 Measurement Workflow
If REW is the software most enthusiasts use, the miniDSP UMIK-1 is the microphone most of them start with.
The UMIK-1 has become popular because it removes much of the complexity traditionally associated with acoustic measurement.
Instead of requiring an audio interface, phantom power, microphone preamps, and calibration equipment, the UMIK-1 connects directly via USB and includes an individual calibration file.
For many enthusiasts, it is the first serious step toward understanding what their room is actually doing.
Typical UMIK-1 Measurement Process
A typical workflow looks something like this:
- Install REW
- Connect the UMIK-1
- Load the calibration file
- Position the microphone at the listening position
- Run a sweep
- Analyse the results
The measurement itself often takes only a few minutes.
Understanding the measurement may take significantly longer.
Common UMIK-1 Mistakes
Many poor measurements are not caused by bad equipment.
They're caused by bad measurement technique.
Common mistakes include:
Measuring Too Close To The Speaker
Room measurements should represent the listening experience.
Placing the microphone close to the speaker often captures information that is not representative of what the listener actually hears.
Incorrect Microphone Orientation
Calibration files are designed for specific orientations.
Using the wrong orientation can affect accuracy.
Measuring Only One Position
A single measurement may not represent the listening area.
Multiple measurements often provide a more complete picture.
Measuring At Unrealistic Listening Levels
Consistency matters.
Measurements should reflect real-world listening conditions whenever possible.
Ignoring Background Noise
HVAC systems, traffic, appliances, and environmental noise can all affect measurement quality.
Why Measurement Quality Matters
A poor measurement often leads to poor conclusions.
Before interpreting any graph, it's worth asking:
Was the measurement itself captured correctly?
Because even the best analysis cannot compensate for bad data.
What Is An MDAT File?
One of the most common requests on audio forums is:
"Can you upload the MDAT?"
Beginners often wonder why.
After all, they've already posted a screenshot of the graph.
Surely that's enough?
Usually it isn't.
What An MDAT File Contains
An MDAT file is REW's project format.
Think of it as the complete measurement package.
Instead of storing only a picture of the graph, it stores the underlying measurement data itself.
This may include:
- Frequency response
- Waterfall data
- Phase information
- Timing information
- Multiple measurements
- Measurement notes
- Project settings
In many cases, dozens of measurements may exist inside a single MDAT file.
Why MDAT Files Are More Valuable Than Screenshots
A screenshot only shows the final graph.
An MDAT file shows the evidence behind the graph.
Imagine two systems that both show a large dip at 80Hz.
The screenshot may look identical.
The causes may be completely different.
One may be suffering from:
- Room modes
The other may be suffering from:
- Phase cancellation
The solution for each problem is different.
This is why experienced users almost always request the MDAT rather than the screenshot.
The more information available, the more accurate the diagnosis becomes.
The Hidden Opportunity Inside MDAT Files
Many enthusiasts spend years collecting measurements.
What they often lack is a framework for prioritising them.
The challenge is rarely finding data.
The challenge is understanding:
- What matters most
- What should be fixed first
- Which issues are highly audible
- Which issues can safely be ignored
This is where interpretation becomes more valuable than measurement itself.
For a deeper dive into the MDAT format and why it matters, see What Is An MDAT File? The REW Measurement Format Explained.
The 10 Most Common REW Mistakes
After reviewing thousands of measurement discussions across forums and communities, the same mistakes appear repeatedly.
1. Chasing Perfect Graphs
Many users assume the goal is a perfectly flat response.
Real rooms do not behave perfectly.
The goal is meaningful improvement, not mathematical perfection.
2. Equalising Every Dip
Some dips cannot be fixed effectively with EQ.
Attempting to do so often creates new problems.
3. Ignoring Room Geometry
Room dimensions have a profound influence on bass behaviour.
No amount of tweaking can completely override physics.
4. Ignoring Speaker Placement
A small placement change can sometimes outperform expensive upgrades.
5. Ignoring Listening Position
The listening position is part of the acoustic system.
Moving the seat can dramatically change measured performance.
6. Measuring Once
Single measurements rarely tell the complete story.
Verification matters.
7. Confusing Visible Problems With Audible Problems
Not every graph irregularity is worth chasing.
Some have little audible impact.
8. Solving Symptoms Instead Of Causes
A dip is not a diagnosis.
It is evidence.
The cause still needs to be identified.
9. Upgrading Gear Before Understanding Measurements
Many enthusiasts buy equipment to solve problems that measurements later reveal are room-related.
10. Never Verifying Improvements
The final step is often skipped.
Measure.
Improve.
Measure again.
Without verification, it's impossible to know whether a change actually worked.
Why Most People Misdiagnose Acoustic Problems
One of the biggest reasons enthusiasts struggle is that many acoustic problems sound similar.
For example:
Weak Bass
Possible causes:
- Room modes
- Phase issues
- SBIR
- Subwoofer placement
- Listening position
Muddy Bass
Possible causes:
- Long decay
- Room modes
- Poor integration
- Excessive overlap between speakers and subs
Poor Imaging
Possible causes:
- Asymmetry
- Reflections
- Placement issues
- Room layout
Harsh Sound
Possible causes:
- Reflections
- Excessive reverberation
- Poor speaker positioning
Without measurements, many users end up guessing.
Even with measurements, diagnosis requires interpretation.
This is why experienced enthusiasts often arrive at completely different conclusions when looking at the same graph.
The graph is evidence.
The interpretation is where expertise enters.
The Difference Between Data And Decisions
This is where many measurement workflows break down.
REW provides data.
Lots of it.
The challenge is converting that data into decisions.
A typical enthusiast may end up with:
- Frequency response graphs
- Waterfall graphs
- RT60 measurements
- Phase plots
- Impulse responses
The question becomes:
What now?
Which issue is most important?
Which fix will have the largest audible impact?
Which problems should be ignored?
Which changes should be prioritised?
This is ultimately the purpose of acoustic analysis.
Not collecting information.
Making better decisions.
A useful measurement workflow should eventually answer four questions:
- What's wrong?
- Why is it happening?
- What should I fix first?
- How do I verify the improvement?
Everything else is supporting evidence.
The graph is not the destination.
The graph is the starting point.
REW vs AudioBro
At this point, it's important to address a question many enthusiasts naturally ask:
If I already have REW, why would I need anything else?
The answer is that REW and AudioBro solve different problems.
REW is one of the most powerful acoustic measurement tools available.
AudioBro was never designed to replace it.
In fact, the better your measurements are, the more useful interpretation becomes.
Think about it this way.
If you visit a doctor, the MRI machine is not competing with the doctor.
The MRI gathers evidence.
The doctor interprets the evidence and recommends what to do next.
Acoustic measurements work in a similar way.
REW provides the evidence.
The challenge is understanding what that evidence means and deciding which actions will produce the greatest improvement.
REW vs AudioBro Comparison
| REW | AudioBro |
|---|---|
| Measures | Interprets |
| Generates graphs | Explains findings |
| Captures evidence | Prioritises actions |
| Technical analysis | Guided recommendations |
| Expert-focused | Beginner to advanced |
| Raw data | Clear next steps |
| Identifies symptoms | Helps identify causes |
| Requires interpretation | Focuses on decisions |
Both tools are valuable.
They simply operate at different stages of the optimisation process.
For a detailed comparison of capabilities, see Room EQ Wizard vs AudioBro: Measurement vs Interpretation.
The Real Problem Most Users Face
Most enthusiasts are not struggling to generate measurements.
They're struggling to answer questions like:
- What is causing this issue?
- Is this a room problem or a speaker problem?
- Should I move the speakers?
- Should I move the listening position?
- Should I add acoustic treatment?
- Should I change crossover settings?
- Should I add another subwoofer?
- Should I use EQ?
These are decision problems.
Not measurement problems.
This distinction is important because collecting more data does not automatically improve sound quality.
Better decisions improve sound quality.
Why Interpretation Matters
A frequency response graph might contain hundreds of visible irregularities.
Yet only a handful may have significant audible consequences.
The goal is not to fix everything.
The goal is to identify:
- The biggest problems
- The highest-value improvements
- The most effective path forward
This is where interpretation becomes more important than measurement itself.
The best optimisation workflows focus on outcomes rather than graphs.
Because nobody listens to graphs.
People listen to music and movies.
Frequently Asked Questions
Is REW free?
Yes. Room EQ Wizard is free acoustic measurement software used by enthusiasts, installers, engineers, and manufacturers around the world.
Do I need a UMIK-1 to use REW?
No. However, a calibrated measurement microphone such as the miniDSP UMIK-1 is strongly recommended if you want accurate results.
What is an MDAT file?
An MDAT file is REW's project format. It stores measurement data, graphs, timing information, phase information, and project settings inside a single file.
Why do forums ask for MDAT files instead of screenshots?
Because MDAT files contain significantly more information. They allow more accurate diagnosis than a screenshot alone.
What causes bass nulls?
Bass nulls are commonly caused by room modes, phase cancellation, SBIR, listening position, and subwoofer placement. Correct diagnosis is essential because different causes require different solutions.
Can REW fix room problems?
No. REW measures room problems. The measurements help identify what is happening. Solutions may involve speaker placement, listening position changes, acoustic treatment, multiple subwoofers, calibration adjustments, or equalisation.
Can EQ fix room modes?
Sometimes partially. However, severe room modes often require placement optimisation, multiple subwoofers, or acoustic treatment for the best results.
Can EQ fix SBIR?
Usually not. SBIR is often a geometry problem rather than a frequency-response problem. Speaker placement and room layout changes are frequently more effective.
What is SBIR?
SBIR stands for Speaker Boundary Interference Response. It occurs when direct sound combines with reflected sound from nearby boundaries, causing cancellations and frequency-response irregularities.
Why does bass sound different in different seats?
This is commonly caused by room modes. Low-frequency behaviour changes dramatically throughout most rooms. A position with strong bass may exist only a short distance from a position with very weak bass.
What is a waterfall graph?
A waterfall graph shows how sound energy decays over time. It helps identify ringing, resonances, and excessive decay that may not be obvious on a frequency-response graph.
Why does my graph look terrible?
Because most rooms are acoustically imperfect. That's normal. The goal is not achieving perfection. The goal is identifying the changes that produce the greatest audible improvement.
Should I buy new speakers or optimise my room?
It depends on the measurements. Many systems benefit more from improvements in placement, acoustics, and integration than from equipment upgrades. Measurements help reveal where the real bottleneck exists.
How many measurements should I take?
More than one. A single measurement can be misleading. Multiple measurements provide a more representative picture of room behaviour.
Is a perfectly flat graph the goal?
Not necessarily. Many excellent systems do not measure perfectly flat. The objective is achieving balanced, natural, enjoyable sound rather than chasing mathematical perfection.
Final Thoughts
One of the biggest myths in audio is that better sound always comes from better equipment.
Sometimes that's true.
Often it isn't.
Many listening rooms contain significant acoustic issues that limit performance long before equipment becomes the bottleneck.
This is why measurement matters.
Measurement reveals what is actually happening.
It replaces assumptions with evidence.
It helps identify room modes, SBIR, phase issues, decay problems, integration challenges, and placement mistakes.
But measurements alone are not enough.
A graph does not tell you what matters most.
A graph does not tell you which problem is worth fixing first.
A graph does not tell you which changes will have the greatest audible impact.
That requires interpretation.
Room EQ Wizard remains one of the most valuable tools available to audio enthusiasts.
It helps you measure.
The next step is understanding what those measurements mean and turning them into better decisions.
Because the goal was never to collect graphs.
The goal was always better sound.
Related Reading
- What Is An MDAT File? The REW Measurement Format Explained — Why MDAT files contain more information than screenshots, and how to use them.
- Room EQ Wizard vs AudioBro: Measurement vs Interpretation — How measurement and interpretation work together to improve your room.
Already have REW measurements?
Upload your MDAT file, REW graphs, or room measurements to AudioBro and get clear guidance on what matters, what can be ignored, and what to fix first.