How to Read a REW Frequency Response Graph: Peaks, Dips and What to Fix First
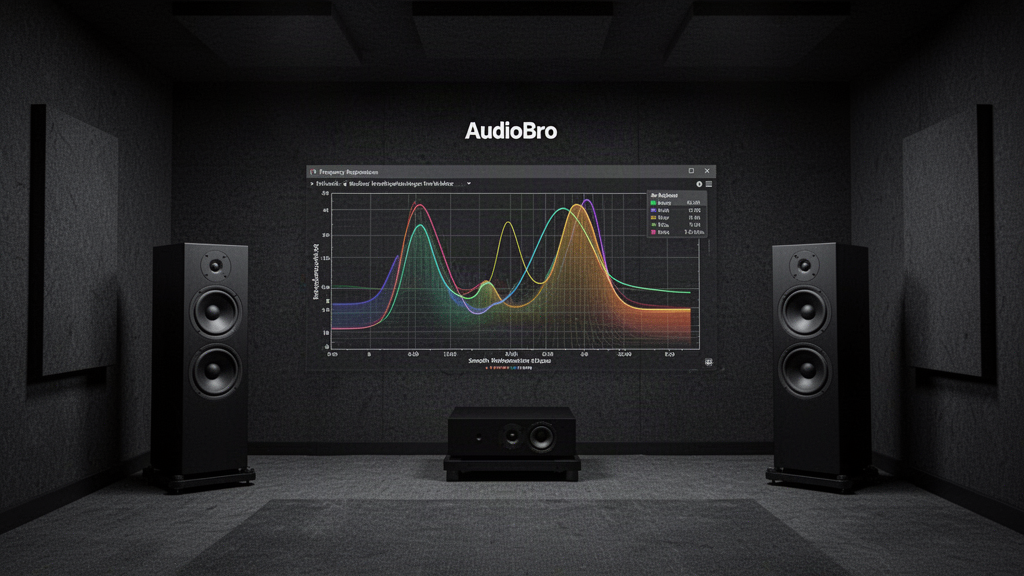
Room EQ Wizard can show you exactly where a system changes its behaviour in the room. The harder part is deciding which parts of the graph matter, which are normal, and which should actually change what you do.
A frequency-response graph is often the first REW measurement people look at. It is also one of the easiest to misread.
A deep dip can look catastrophic but be caused by cancellation that EQ cannot sensibly repair. A broad rise can matter more than a narrow spike. Heavy smoothing can make a poor bass response look deceptively tidy. And a graph that looks less flat may sometimes sound better because the target is not supposed to be a ruler-straight line.
This guide explains how to read a REW frequency-response graph as evidence rather than as a scorecard.
What a REW Frequency-Response Graph Shows
At its simplest, the graph plots frequency on the horizontal axis and sound-pressure level on the vertical axis.
Frequency is measured in hertz. Low frequencies sit on the left, high frequencies on the right. SPL is measured in decibels and tells you the measured level at each frequency at the microphone position.
If the trace rises around 50 Hz, the room and system are producing more energy there relative to nearby frequencies. If it falls sharply around 80 Hz, less energy is reaching the microphone at that frequency.
That sounds straightforward. The important qualification is that the graph is not a measurement of the loudspeaker alone.
In a room, the trace contains the combined effects of:
- the loudspeaker or subwoofer
- its position
- the listening position
- room modes
- boundary interactions
- reflections
- crossover integration
- level and delay relationships
- any EQ or room correction already active
That is why the same loudspeaker can produce substantially different measurements after moving only the speaker or microphone.
Start With the Bass Region
For most domestic rooms, the low-frequency region is where a frequency-response measurement becomes particularly useful.
Below the room's transition region, the response is strongly affected by room modes and boundary interactions. Peaks and dips can change dramatically across relatively small changes in position.
A large peak may indicate that the source and listening position are strongly exciting a room mode. A deep null may indicate destructive cancellation. Multiple subwoofers, crossover behaviour and phase relationships can add further complexity.
The mistake is assuming every visible irregularity has the same solution.
It does not.
Peaks
A broad or persistent bass peak is often a good candidate for investigation and, once the physical setup is sensible, potentially EQ.
Reducing excess energy is generally much easier than trying to fill a cancellation null.
But first ask whether the peak changes significantly when the speaker, subwoofer or listening position moves. If it does, placement may offer a better solution than immediately applying a filter.
Dips and Nulls
Deep narrow dips deserve caution.
If two sound paths arrive substantially out of phase at the listening position, they can cancel. Adding more electrical gain at that frequency may simply make both contributions stronger while they continue cancelling.
A 12 dB hole does not automatically mean you should add a 12 dB boost.
Before attempting EQ, investigate whether the dip changes with:
- listening position
- speaker or subwoofer position
- crossover frequency
- subwoofer polarity or phase
- delay or distance settings
- measurement position
If a small physical change causes a large response change, you have learned something important about the mechanism.
Broad Problems Usually Matter More Than Tiny Ones
REW can display enormous detail. That does not mean every wiggle deserves attention.
A broad 4 dB rise spanning a large part of the bass or midrange can have a clear tonal effect. A very narrow feature covering only a few hertz may be far less perceptually important.
Look for patterns, not individual pixels.
Useful questions include:
- Is the problem broad or narrow?
- Does it affect one channel or both?
- Does it repeat at nearby microphone positions?
- Is it confined to the bass?
- Does it begin around a crossover?
- Does it correspond with what you actually hear?
The graph becomes much more useful when it is connected to a symptom.
"There's a dip at 83 Hz" is data.
"The bass loses weight at the main seat, and both the left-plus-sub and right-plus-sub measurements show a strong cancellation around the crossover region" is the beginning of a diagnosis.
Smoothing: How Much Should You Use?
Smoothing reduces visual detail so the overall trend is easier to see.
There is no single smoothing setting that is correct for every question.
For low-frequency diagnosis, excessive smoothing can hide the very modal behaviour you are trying to investigate. For broad tonal assessment at higher frequencies, an unsmoothed trace can contain so much fine detail that the important trend becomes difficult to see.
Common REW views include unsmoothed, 1/48, 1/24, 1/12 and 1/6 octave smoothing, along with psychoacoustic and variable smoothing options.
A useful principle is:
Use enough resolution to preserve the behaviour you are investigating, but not so much that irrelevant fine structure dominates the interpretation.
For bass work, compare higher-resolution views before drawing conclusions. For overall tonal balance, a more smoothed view can make the broad trend easier to understand.
Never use smoothing merely to make the graph look better.
Do Not Chase a Perfectly Flat Line
One of the most persistent measurement mistakes is treating flatness as the universal objective.
A measured in-room response is not the same thing as an anechoic loudspeaker response. The room contributes reflected energy, and the preferred in-room balance commonly has some downward tilt toward the high frequencies rather than remaining mathematically flat from bass to treble.
Target curves, including Harman-style curves, can provide useful references. They are not commandments.
The correct question is not:
How do I force every point onto the target?
It is:
Does the broad response make acoustic and perceptual sense, and are the remaining deviations caused by something we should actually fix?
Our detailed guide to the Harman Curve and room-EQ target curves explains that distinction further.
Measure Left, Right and Combined
A combined stereo measurement can hide useful information.
Measure the left and right channels separately when diagnosing stereo behaviour. If subwoofers are involved, measure useful combinations separately as well.
Why?
Because two channels can produce different responses due to asymmetric boundaries, furniture, openings or placement. When measured together, interference between the channels can also create features that are not representative of either speaker individually.
Separate traces help answer questions such as:
- Is this problem present in both speakers?
- Is it caused by one side of the room?
- Does the subwoofer integrate differently with left and right?
- Is the combined trace creating cancellation that is absent individually?
Diagnosis improves when you can isolate variables.
The Crossover Region Deserves Special Attention
When a subwoofer and main speaker overlap, the resulting response depends on more than their individual frequency responses.
Level, phase, delay, polarity, filter slopes and acoustic distance all affect the sum.
If the main speaker looks healthy by itself and the subwoofer looks healthy by itself, but the combined response develops a hole around the crossover, that is an integration clue.
Do not immediately boost the hole.
Compare the component measurements and investigate the relationship between them.
This is where frequency response should often be considered alongside phase, impulse timing and the system's crossover configuration.
One Measurement Is Not the Whole Room
A microphone measurement is evidence from a location.
It is not a complete map of the room.
A response that looks excellent at one point may change substantially 20 or 30 cm away, especially in the bass. Conversely, a terrifying narrow null at one exact microphone position may not represent what both ears perceive across a normal listening area.
For a single-seat stereo system, the main listening position is obviously important. But nearby measurements can tell you whether a feature is stable or highly position-dependent.
For multi-seat home theatre, spatial consistency becomes even more important.
This is one reason automated room correction systems use multiple microphone positions: they are trying to understand behaviour across an area rather than optimise one mathematical point in space.
What Frequency Response Cannot Tell You
A frequency-response graph is powerful, but it cannot answer every acoustic question.
Two systems can show similar magnitude response while behaving differently in time.
Frequency response alone does not fully describe:
- decay
- ringing
- arrival timing
- phase relationships
- reflection timing
- reverberation behaviour
That is why REW includes waterfalls, spectrograms, impulse response, phase, group delay and other views.
The correct graph depends on the question.
If bass sounds slow or hangs around, a decay view may add evidence that magnitude alone cannot provide. If a crossover is cancelling, phase and timing may matter. If imaging is poor, room geometry and reflections may be more relevant than a small frequency-response deviation.
A Practical REW Reading Order
When you open a frequency-response measurement, resist the temptation to start drawing filters.
First confirm the measurement itself is trustworthy: microphone calibration, channel selection, signal path, level and room-correction state should all be known.
Then work through the response in this order:
- Look at the broad tonal trend. Is there an obvious overall tilt, bass excess or missing region?
- Inspect the bass at useful resolution. Identify broad peaks, deep nulls and repeating modal patterns.
- Compare left and right. Separate room asymmetry from system-wide behaviour.
- Inspect the crossover region. If a subwoofer is involved, compare individual and combined traces.
- Check nearby positions where useful. Determine whether the feature is stable or position-specific.
- Connect the graph to the audible complaint. Do not solve something simply because it is visible.
- Choose the physical variable most likely to matter. Placement, seating, crossover, phase, delay or treatment may come before EQ.
- Change one thing and measure again. Verification is what turns a plausible theory into evidence.
That last step is essential.
Why EQ Should Usually Come After Diagnosis
EQ is extraordinarily useful when applied to the right problem.
It is much less useful when it is being asked to compensate for poor geometry or cancellation.
Before applying correction, ask whether the response problem is primarily caused by something that can be improved physically.
Examples include moving the listening position away from a severe modal null, changing subwoofer position, improving sub/main alignment, adjusting speaker placement or addressing a strong reflection.
Once those fundamentals are sensible, EQ can be used more intelligently.
This is also why REW and room-correction systems such as Dirac Live are complementary rather than interchangeable. REW gives you measurement and diagnostic visibility. Room correction can apply filters. Neither removes the need to understand what the room and system are doing.
From REW Data to a Decision
This is the gap that catches many enthusiasts.
REW is exceptionally capable at showing what happened in the measurement. The harder part is determining why it happened and what should change first.
Modern AudioBro is designed around that decision layer.
AudioBro can work with native REW MDAT measurements alongside room photographs, room dimensions, system information, speaker and listening-position context, and supported calibration evidence. Rather than treating a graph as an isolated screenshot, the aim is to connect measurement evidence with the physical room and the history of the system.
That matters because the same 70 Hz dip can imply very different next steps depending on whether it is associated with a room mode, a boundary cancellation, a subwoofer crossover, a left/right asymmetry or a measurement artefact.
AudioBro's specialist measurement and room-analysis capabilities establish the evidence; the conversational layer helps associate, prioritise and explain it.
The objective is not to replace REW.
It is to make the path from measurement → diagnosis → action → verification easier to follow.
If you already have REW measurements, see AudioBro REW Analysis. If you are working with native REW data, our guide to what an MDAT file is explains why the original measurement file contains far more useful information than a screenshot.
Measure, Change, Verify
A good REW graph is not the finish line.
It is evidence.
The most useful workflow is simple:
Measure → understand → change one meaningful variable → measure again.
If the new measurement improves in the region you were targeting and the listening result agrees, confidence increases.
If it does not, that is useful too. You have eliminated a hypothesis without spending money on another component.
That is the real value of measurement: not prettier graphs, but better decisions.
Explore AudioBro
Analyse your REW measurements with AudioBro
Learn what is stored inside a REW MDAT file